Project
Automated Homicide Data Scraper & Visualizer
Making Baltimore City crime data accessible and visual for the public — instead of buried in spreadsheets.
Motive
Why I Built This
Baltimore's homicide data is publicly available but practically inaccessible — scattered across PDFs and raw spreadsheets that are hard for the average person to parse. I wanted to turn that raw data into something anyone could explore visually, see patterns in, and draw real conclusions from. If the data is public, it should actually be usable.
Stack
Tech Stack
Features
What It Does
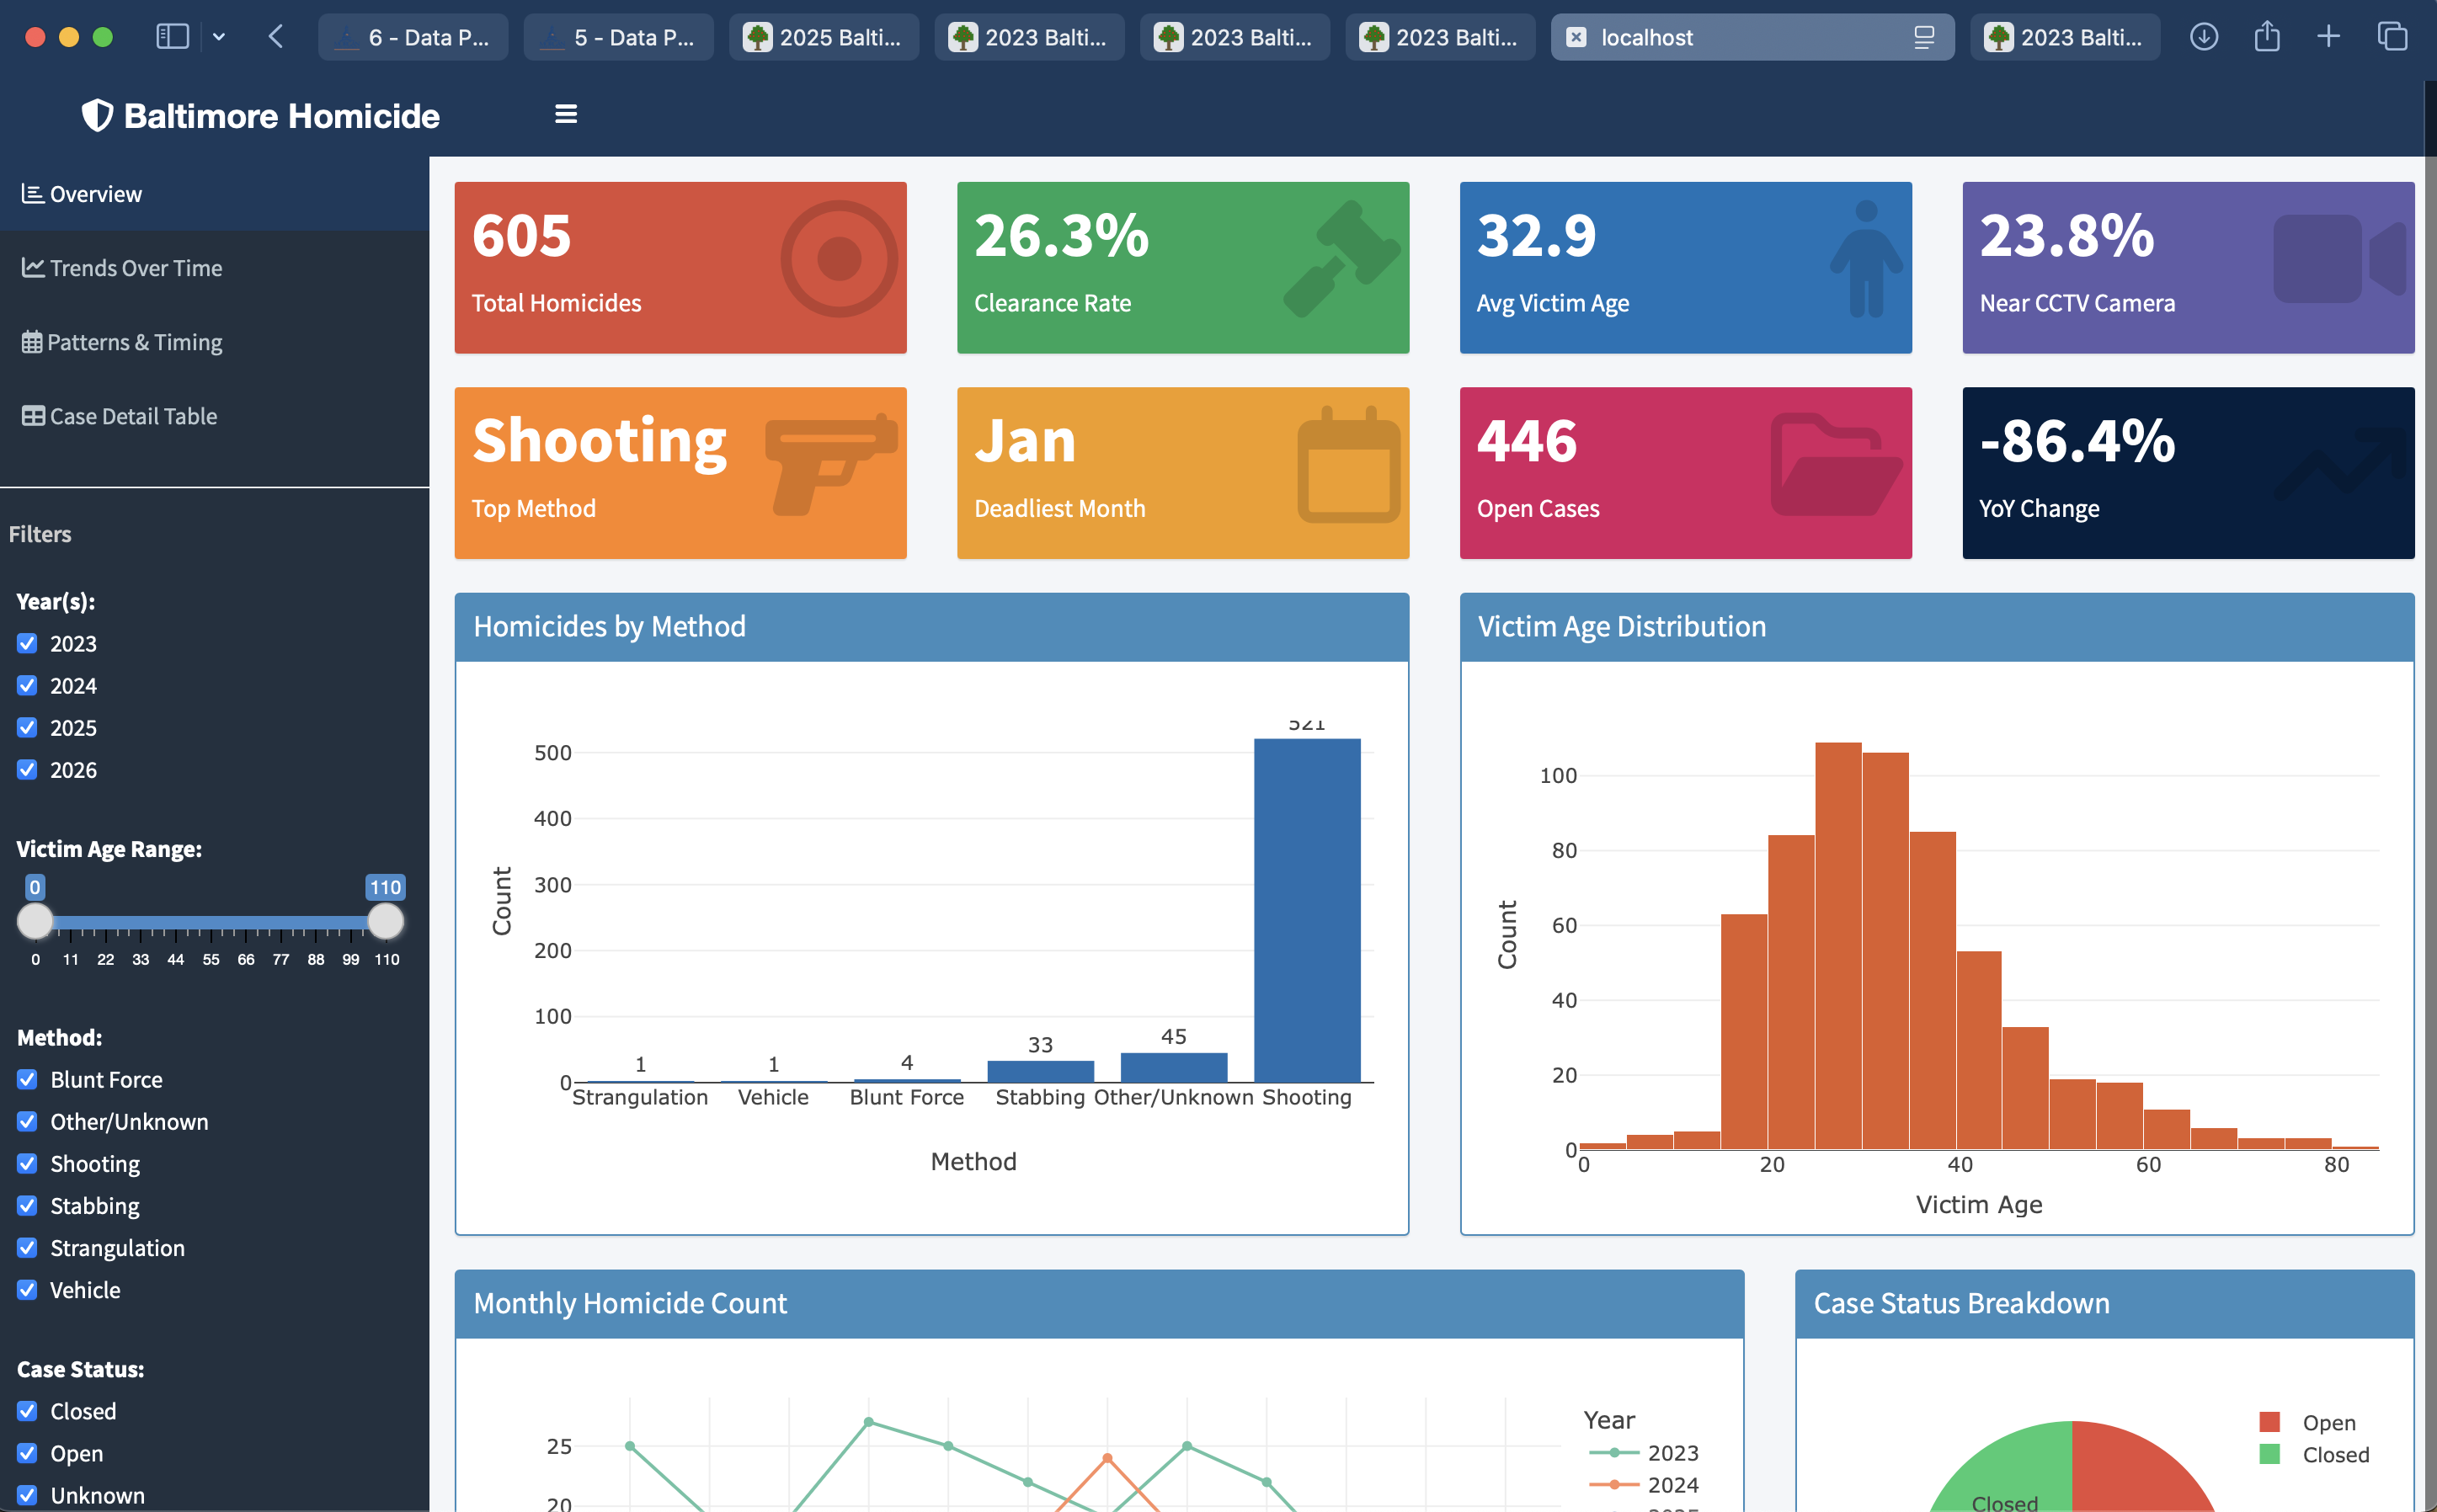
Scrapes and visualizes Baltimore City homicide records into a live Shiny dashboard with an interactive map, year-over-year trends, and exportable case tables. The data updates automatically so the dashboard always reflects the latest available records.
Roadmap
What's Next
Updating soon
Links